🎯 Learning Objectives
- Select data in order to visualise a data set
- Analyse visualisation to identify patterns, trends, and outliers
- Draw conclusions and report findings
💬 Key Vocabulary
- data
- PPDAC
- analysis
- conclusion
- investigative cycle
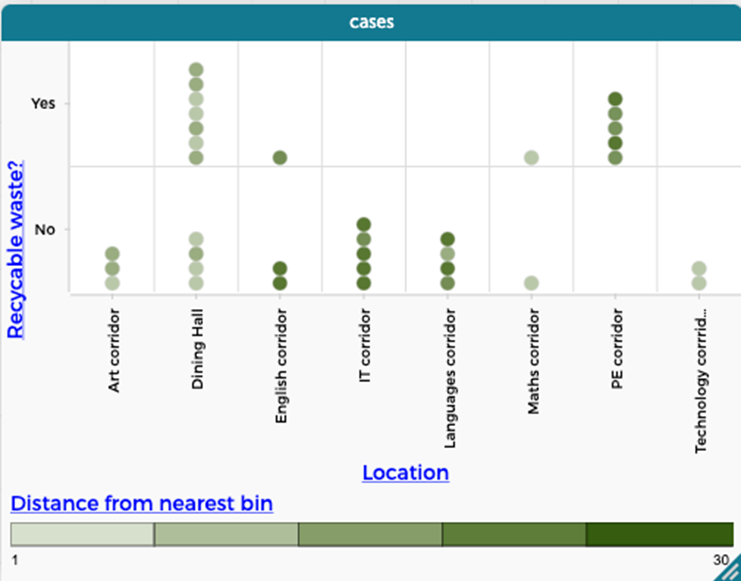
📝 Starter Activity – School Litter
- Can we draw any conclusions from this visualisation?
- Does it warrant any further investigation?
- What other information would be useful?
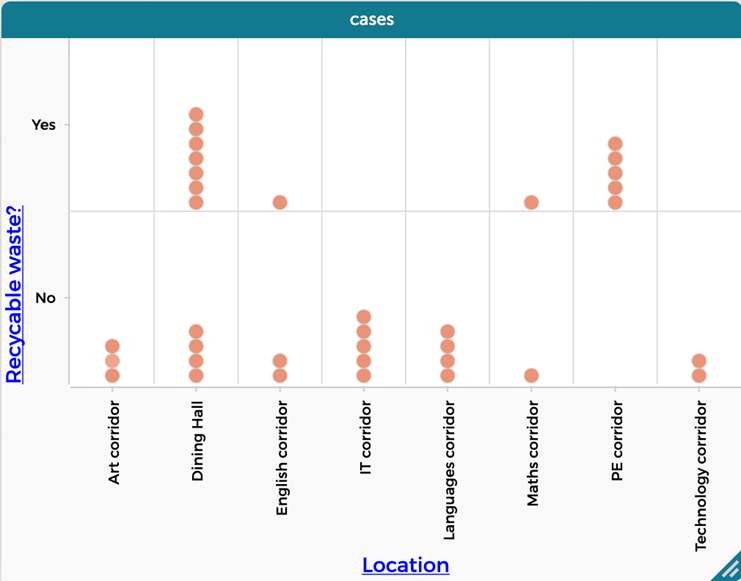
- What data has been added to this visualisation?
- What insights can you draw from this visualisation?
- Could you make any recommendations to Mr Law as a result?
📝 Level 1 – More Litter Analysis
Open the Level 1 worksheet found at the download link below:
- Explore the second question that you posed in Lesson 4 using codap.concord.org
- Insert an image of your visualisation
- Describe what you have learnt from the visualisation

📝 Conclusions and recommendations
What’s the answer to your question?
How does the data help prove the answer?
Is the answer reliable?
What can we do with the results?
Can we use this data to make a case for action, or has it led to further questions that need to be answered?

📝 Level 2/3 – Drawing conclusions
Complete the Level 2/3 worksheet you can download below.
Answer the questions and make a recommendation to the school leadership team about what the next steps should be.
🏅 Level Up
🥇 Level 1
- Upload the Level 1 – More Litter Analysis activity sheet to the Teams assignment.
🥈 Level 2
- Upload the Level 2/3 – Drawing conclusions activity sheet to the Teams assignment.
🥉 Level 3
- Upload the Level 2/3 – Drawing conclusions activity sheet with the Level 3 work complete to the Teams assignment.
In this lesson, you…
- Continued with the work from last lesson to:
- Visualise your data
- Analyse your visualisation to spot patterns, trends, and outliers
- Drew conclusions and made a recommendation to the school leadership team based on your findings.
In this topic you…
- Investigated problems and made changes to the world around you.
- Understood how data visualisation helps to identify patterns and trends that may not be obvious in raw data.
- Identified and used the steps of the PPDAC (problem, plan, data, analyse, conclusion) investigative cycle.
- Applied these skills to a real-world problem by collecting, cleaning, and analysing data before reporting their conclusions.