🎯 Learning Objectives
- Describe the need for data cleansing
- Apply data cleansing techniques to a data set
- Visualise your own data set
💬 Key Vocabulary
- data
- PPDAC
- analysis
- data capture
- investigative cycle
- data cleansing
📝 Level 1 – Clean it up
For your homework you gathered the data.
Once we have the data we need to help us answer our question, we should look through it to see if it needs cleansing.
Cleansing involves detecting and correcting, or removing, corrupt or inaccurate data.

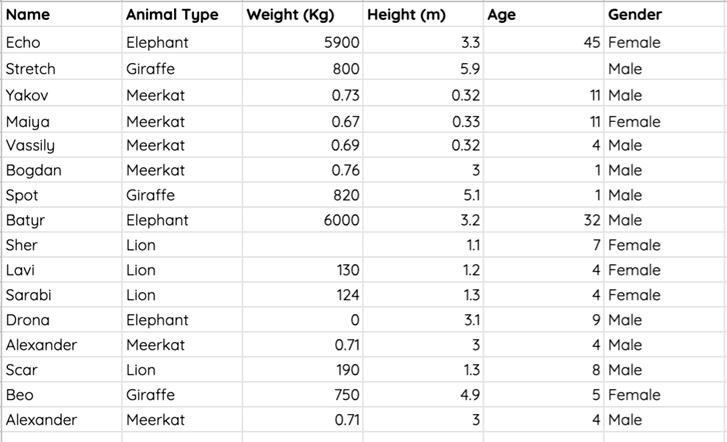
Click the download button below to find a data set about zoo animals.
Spend some time looking at the data and see whether it is ready for analysis.
Check to see if any data needs correcting. If so, how might you correct it?
Work independently at first and then pair up to discuss your findings.
📝 Data Download
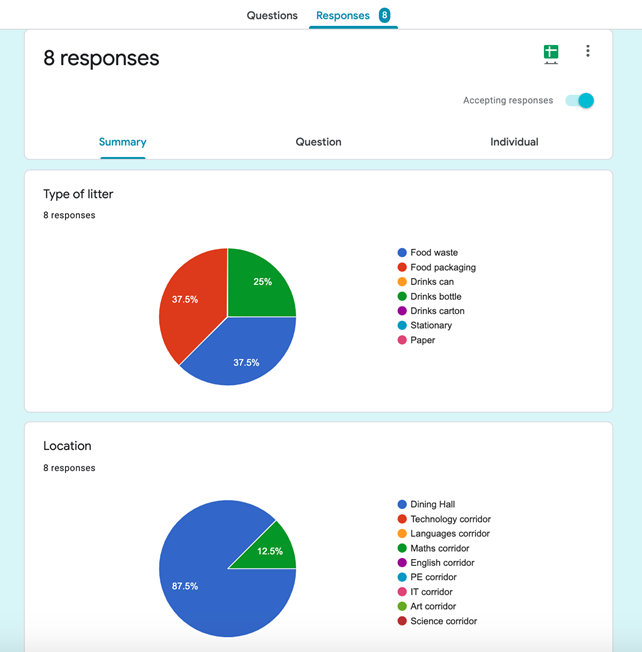
Online forms often have the ability to visualise responses.
Some of them may be helpful to us, but none of them will show the potential relationship or correlations between the variables.
Before we use a tool to help us create visualisations, we need to check the data for any errors and download the data to a spreadsheet.
Your teacher will show you how to download the data and check for any issues.
📝 Data Upload
We’re now going to upload our data into CODAP to help us analyse it.
CODAP accepts data as plain text (not a spreadsheet file type).
You need to save your data from the spreadsheet you downloaded from Microsoft Forms as a .csv file.
CSV (which stands for comma-separated values) is a plain text file format.

Follow the steps below
- Save your spreadsheet as a CSV file
- Open the CODAP website (codap.concord.org)
- Create a new document by selecting Launch CODAP
- Click Open Document
- Click Local File
- Upload the CSV file
📝 Level 2/3 – Data Analysis
Download and open Level 2/3 worksheet below.
Explore one question that you posed in the last lesson.
Insert an image of a visualisation.
Describe what you have learnt from the visualisation.

📝 Plenary – Show & Tell
Be prepared to discuss:
- A question that you posed
- The visualisation that helps you to answer the question, and which variables you have included in the visualisation
- What conclusions (if any) you can draw
- Would any further investigation or data help you to answer the question?
🏅 Level Up
🥇 Level 1
- Upload the Level 1 – Clean it up Excel file with the incorrect data highlighted to the Teams assignment.
🥈 Level 2
- Upload the Level 2/3 – Data Analysis activity sheet to the Teams assignment.
🥉 Level 3
- Upload the Level 2/3 – Data Analysis activity sheet with a second visualisation to the Teams assignment.
In this lesson, you…
- Looked at how you can go through the process of data cleansing, and how unclean data can cause problems when analysing data
- Created a visualisation on your own data sets to help you answer the questions you posed
Next lesson, you will…
- Continue with the analysis before you begin to draw conclusions